Pet Documetation/ Teaching
Machine Learning and Data Science through Pet training
Purpose
Learn how to output various images/animation based off of a Linear Regression model. Machine learning is very versatile! It can be used for simple games like this Pet Trainer, or more complex scientific purposes like healthcare or cybersecurity.
Data Collection
This specific feature was trained using the self-created data set below. Data can be taken from multiple source such as pre-made API’s, open-source databases, and more. It does not need to be freshly created.
data = {
    'food': [1, 2, 3, 4, 5, 2, 1, 3, 4],
    'play': [5, 4, 3, 2, 1, 3, 4, 1, 5],
    'sleep': [2, 2, 3, 4, 5, 5, 4, 3, 1],
    'happiness': [6, 7, 8, 9, 9, 6, 5, 6, 8]
}
Processing
The data is processed using a Linear Regression model. This is done by splitting the features (food, play, sleep, happiness) into the variable ‘X’ and the target (happiness) into the variable ‘Y’.
- Linear regression is mathematical. The X and Y are plotted and a line of best fit is created to most accurately predict the happiness/ target.
- It can be usually explained using an equation like this: Happiness=(a⋅food)+(b⋅play)+(c⋅sleep)
- Variable A, B, and C are the weight of feature importance that the model learned.
Here’s an example:
- If the model learns that A is work 1.2, B is 0.5, C is 2.0, and the user inputs a value of 4 for food, the computer will do (1.2 x 4). Based off of the other inputs, it will add all values together and display the total happiness score of the pet.
Below is the full code on how to split the data.
from sklearn.linear_model import LinearRegression
from sklearn.tree import DecisionTreeRegressor
from sklearn.model_selection import train_test_split
import pandas as pd
import numpy as np

class Pet:
    _instance = None

    def __init__(self):
        self.model = None
        self.dt = None
        self.features = ['food', 'play', 'sleep']
        self.target = 'happiness'
        self.pet_data = self._load_data()

    def _load_data(self):
        # Simulated training data
        data = {
            'food': [1, 2, 3, 4, 5, 2, 1, 3, 4],
            'play': [5, 4, 3, 2, 1, 3, 4, 1, 5],
            'sleep': [2, 2, 3, 4, 5, 5, 4, 3, 1],
            'happiness': [6, 7, 8, 9, 9, 6, 5, 6, 8]
        }
        return pd.DataFrame(data)

    def _train(self):
        X = self.pet_data[self.features]
        y = self.pet_data[self.target]

        self.model = LinearRegression()
        self.model.fit(X, y)

        self.dt = DecisionTreeRegressor()
        self.dt.fit(X, y)

    @classmethod
    def get_instance(cls):
        if cls._instance is None:
            cls._instance = cls()
            cls._instance._train()
        return cls._instance

    def predict(self, data):
        df = pd.DataFrame([data])
        prediction = self.model.predict(df)[0]
        return {'predicted_happiness': round(prediction, 2)}

    def feature_weights(self):
        importances = self.dt.feature_importances_
        return {feature: round(importance, 2) for feature, importance in zip(self.features, importances)}
Modeling/ Training
This should be done under the model file in the backend.
def testPet():
    print(" Step 1: Sample Pet Data")
    pet = {'food': 3, 'play': 4, 'sleep': 3}
    print("\t", pet)
    model = Pet.get_instance()

    print(" Step 2: Predict Happiness")
    prediction = model.predict(pet)
    print("\t Predicted Happiness:", prediction)

    print(" Step 3: Feature Importance")
    importances = model.feature_weights()
    for k, v in importances.items():
        print(f"\t {k}: {v}")

if __name__ == "__main__":
    testPet()
Using this code, a test run of the program can be done, displaying how well the Regression model and feature is working. If executing, it will show the sample input (data) that was created before, the predicted happiness, and the importance of each feature. The next step is to create the API endpoint.
from flask import Blueprint, request, jsonify
from flask_restful import Api, Resource
from model.pet import Pet

pet_api = Blueprint('pet_api', __name__, url_prefix='/api/pet')
api = Api(pet_api)

class PetAPI:
    class _Predict(Resource):
        def post(self):
            data = request.get_json()
            pet_model = Pet.get_instance()
            prediction = pet_model.predict(data)
            return jsonify(prediction)

    class _FeatureWeights(Resource):
        def get(self):
            pet_model = Pet.get_instance()
            weights = pet_model.feature_weights()
            return jsonify(weights)

    api.add_resource(_Predict, '/predict')
    api.add_resource(_FeatureWeights, '/features')
Split your main mode (PetAPI) into sub classes. Each of these classes is what the api endpoint will be names (Predict class is /predict). Remember to update the main.py
Now, the output
Simple frontend can be created by attatching the api endpoint (/api/pet/predict') in this case. In order to display different images based off of the result given by the Linear Regression model, we must use conditional statments.
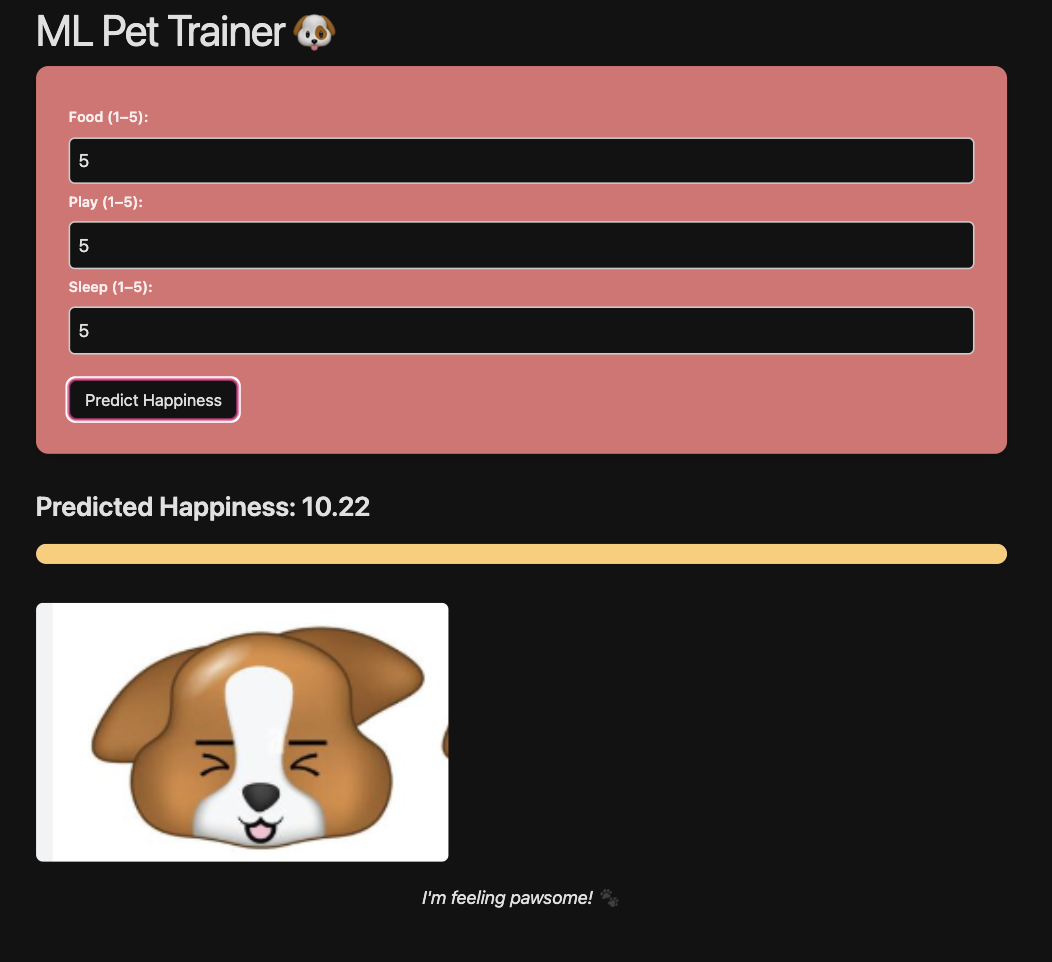
The statement resultDiv.innerHTML = `<h3>Predicted Happiness: ${happiness}</h3>`; is connected to the backend and uses the happiness score that was predicted. Using the variable “happiness,” we can contruct something that looks like this:
if (happiness > 8) {
imageSrc = "/datascience_frontend/images/happy.png";
message = "I'm feeling pawsome! 🐾";
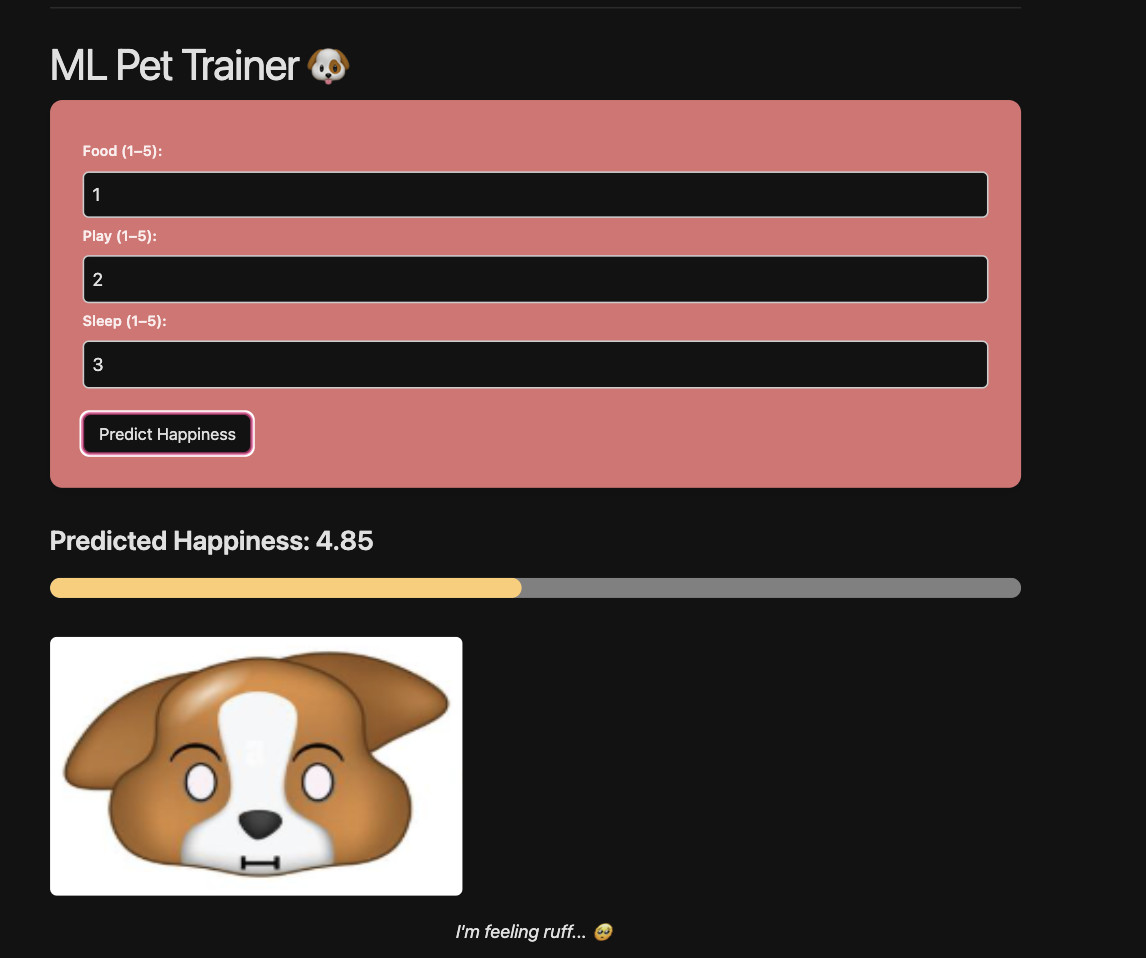
} else if (happiness < 5) {
imageSrc = "/datascience_frontend/images/sad.png";
message = "I'm feeling ruff... 🥺";
}
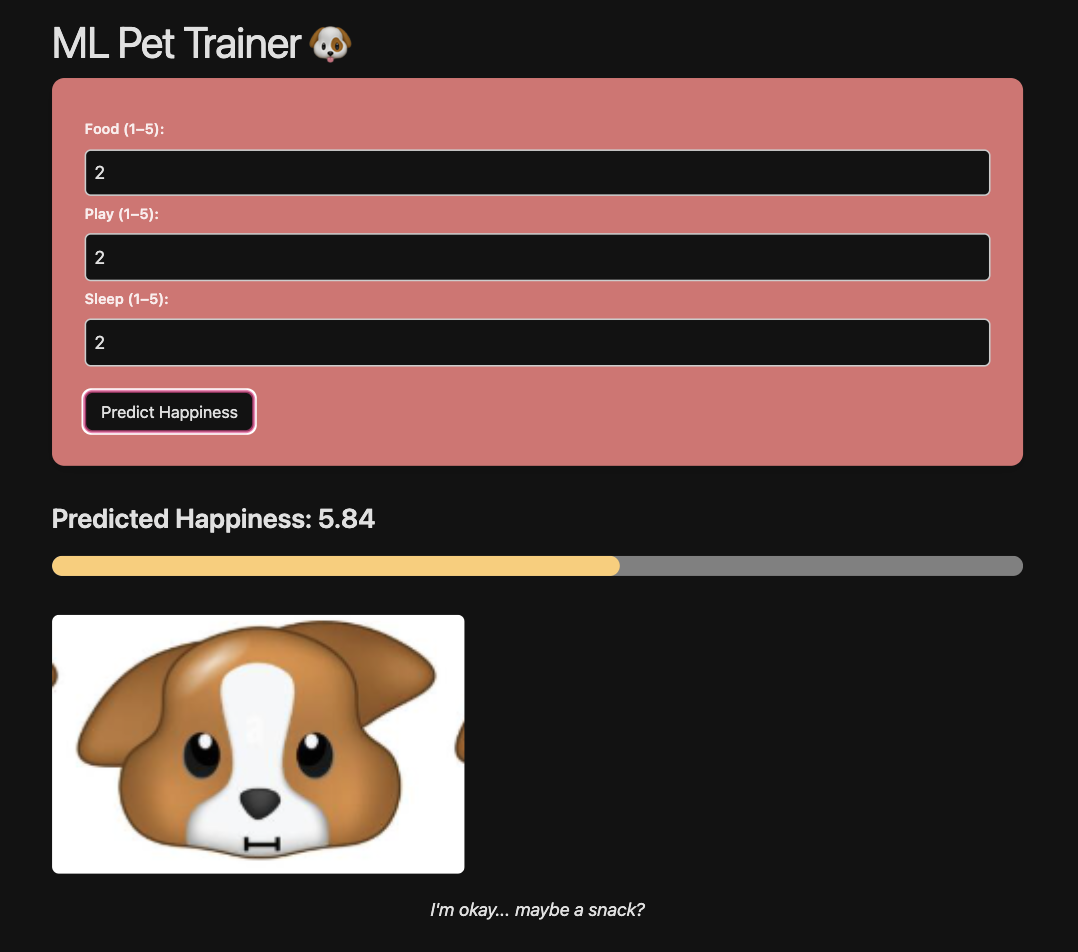
If the happiness given by the data anlysis is less than 5, the image will change to a sad dog. If it is above 8, than it will display a happy dog. These numbers can be changes and tweaked to suit programmer preferences.
Next Steps
What can we do next with this? How can we improve? Here are some suggestions:
- Add the ability to switch between pets. Not everyone is a dog person!
- Add differnet forms of outpts. Maybe add a sparkle sound effect for good happiness results or a sad tone for low scores.
- Learn about other data models using the other blogs on this website to add even ways to analyze the data
Conclusion
This project shows how linear regression can predict a pet’s happiness based on food, play, and sleep. By combining a trained model with a simple frontend, we can display different images based on the prediction, making machine learning both fun and interactive.
It’s a great example of how data science can be used creatively. With more features or pet types, this project could grow even further.
All Together
| Happy | Sad | Neutral |
|---|---|---|
 |
 |
 |